High Altitude Balloon
(HAB)
Data Logging for Big Data
div>
High Altitude Balloon
(HAB)
Data Logging for Big Data
div>
Introduction and Description
 This challenge was to create an educational or academic application of a near space experiment utilizing high altitude weather balloon for use in my content area of eighth grade computer science. This product used a weather balloon, which is a type of high altitude balloon, specifically used for transporting scientific payloads to the Earth’s upper atmosphere.
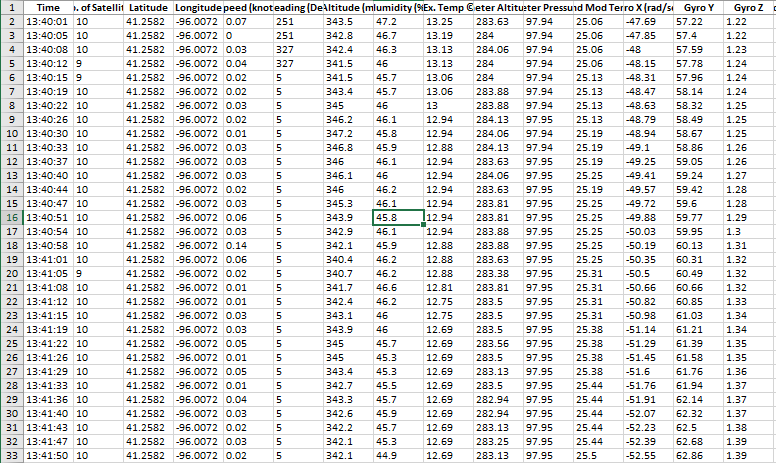
This project challenged me to build a payload for a High Altitude Balloon launch. The payload was then launched on April 19, 2019. My original academic application was to use the Raspberry Pi and weather sensors to collect and record data to measure some characteristics of Earth's atmosphere and readings during the launch. In my computer science classroom, I will use the data gathered during the launch and flight as a way of getting students to use Big Data and learn how we turn data into meaningful and useable information. I have not yet had the opportunity to complete this unit with my class but plan on doing so before the end of this year. Since, I have not completed this project with the class I will show some of the data gathered during the launch.
Computer Science: Purpose
 Computers, Data and Big Information
In the first half of this unit students are introduced to the concepts of computers and computing while investigating the major components of computers and the suitability of these components for application and use. Fundamental notions of Human Computer Interaction (HCI) as well as looking past the individual bits and bytes of our binary code to how see how the data is collected and changed into information humans can understand and use. Students will learn that “intelligent” machine behavior is not “magic” but is based on algorithms applied to useful representations of information, including large data sets. Students will learn the characteristics that make certain tasks easy or difficult for computers, and how these differ from those that humans characteristically find easy or difficult.
In the second half of the unit, Data and Society will cover the importance of data in solving problems and highlights how computers can help in this process. We explore the different systems and ways to use and represent information in a computer and the challenges and tradeoffs posed by using them. Students also learn how collections of data are used to solve problems, and how computers help to automate the steps of this process. Students will gain an appreciation for the many ways in which computing-enabled innovation has had an impact on society, as well as for the many different fields in which they are used. Connections among social, economic and cultural contexts will be discussed. Finally, this part of the unit further explores the ways that digital information is encoded, represented and manipulated. Being able to digitally manipulate data, visualize it, and identify patterns, trends and possible meanings are important practical skills that computer scientists do every day. Understanding where data comes from, having intuitions about what could be learned or extracted from it, and being able to use computational tools to manipulate data and communicate about it are the primary skills addressed in the part of the unit.
In the final project of the unit, student will use large data sets to analyze data and use it to develop insights and inferences found in the data. Students will use computers and software tools to translate, process and visualize data to find patterns and test their hypotheses. Working with a variety of large data sets students will illustrate how data and information facilitates identification of problems and solutions. Students will use data to discuss appropriate methods for data collection and aggregation of data necessary to support making a case or facilitating a discovery.
Unit objectives:
Students will be able to:
• Choose the best way to represent some information based on how it will be used.
• Use the problem-solving process to answer a question using data.
• Provide examples of how representing data in diverse ways can affect its ability to
understood.
• Interpret collected data to identify patterns then use that data to draw conclusions.
• Give examples of how data is collected from sensors and for tracking proposes.
• Determine data that would be helpful in solving a problem or answering a question
• Identify and remove irrelevant data from a data set.
• Use tables and visualizations summarizing data to support a decision
• Present and critique interpretations of tables and visualizations
• Visually organize data to highlight relationships and support a claim.
• Use a tool that provides access to “big data” and investigate its sources.
• Provide plausible explanations of trends and patterns observed within a data visualization.
The students will work independently and in small groups to learn, develop and practice their big data and information processing skills and knowledge to perform and complete various tasks to display and represent the data.
In this unit the students will use Microsoft Excel and other online data representation tools which will allow the students to create and visualize their data in real time, so they can focus more on the thought process, and understanding data to format the data and turn it into information that is clear and meaningful to humans.
Computer Science: Standards
Every great lesson starts with addressing the standards that that lesson or unit is going to cover.
Here are the following standards that this productions application covers and supports.
This lesson is aligned with the 2018-2019 Nebraska CTE Course Standards and Programs of Study - Middle-Level Courses for Communication and Information Systems: Introduction to Computer Science (270411) – and the Nebraska Science Standards
Standard 2 - Data and Information
Indicator 2.3 - Use data to create an abstraction to model something in the real world.
Indicator 2.4 - Use data and abstraction to draw conclusions about the real world.
Nebraska Science Standards
P1 - Asking questions & defining problems
P2 - Practice Developing and using models
P4 - Analyzing and interpreting data
P8 - Obtaining, evaluating, and communicating information
(Nebraska Science Standards, 2018)
This lesson is also aligned with the 2018-2019 Project Lead the Way Computer Science Course Standards.
PLTW - Data and Analysis
- Explain the processes used to collect, transform, and analyze data to solve a problem using computational tools (e.g., use an app or spreadsheet form to collect data, decide which data to use or ignore, and choose a visualization method).
(Project Lead the Way Computer Science Standards, 2017)
Unit Overview
The Computer Data and Big Information Unit will be the first unit covered in the Introduction to Computer Science II course curriculum.
There are 15 lessons which will be delivered as part of this unit. Each “Lesson” will take approximately one class period to cover. Assignments, along with formative and summative assessments are built in to each lesson. At the end of each lesson, students will be asked to complete an independent assignment used to demonstrate their understanding and knowledge of each skill presented. The unit will conclude with a creative task/project.
In addition to the lesson and assignments, students will be completing a ‘Creative Task’ project at the end of the unit. The creative project will be delivered and assessed at the end of the unit. The lessons are labeled in numerical order will be delivered and completed in that order. Lessons advance in level of difficulty, complexity and will build on and utilize skills obtained in previous lessons. All lessons are designed to be delivered in the classroom setting with each lesson taking approximately 90 minutes or one class period to complete.
The creative tasks will span multiple class periods to complete.
| Lesson | Lesson TItle | Duration |
|---|---|---|
| Lesson 1 | What is a Computer – Turing Machines | One Class Period |
| Lesson 2 | Input and Output | One Class Period |
| Lesson 3 | Processing and Storage | One Class Period |
| Lesson 4 | Is it a Computer – Classifying computer | Two Class Period |
| Lesson 5 | Binary | One Class Period |
| Lesson 6 | Patterns and Representation | One Class Periods |
| Lesson 7 | Data Representation Matters | One Class Period |
| Lesson 8 | Problem Solving with Big Data | One Class Period |
| Lesson 9 | Structuring Data | One Class Period |
| Lesson 10 | Making Decisions with Data | One Class Period |
| Lesson 11 | Interpreting Data Visually | One Class Period |
| Lesson 12 | HAB Project – Create a Data Visualization | Two Class Periods |
| One Class Period in 90 minutes |
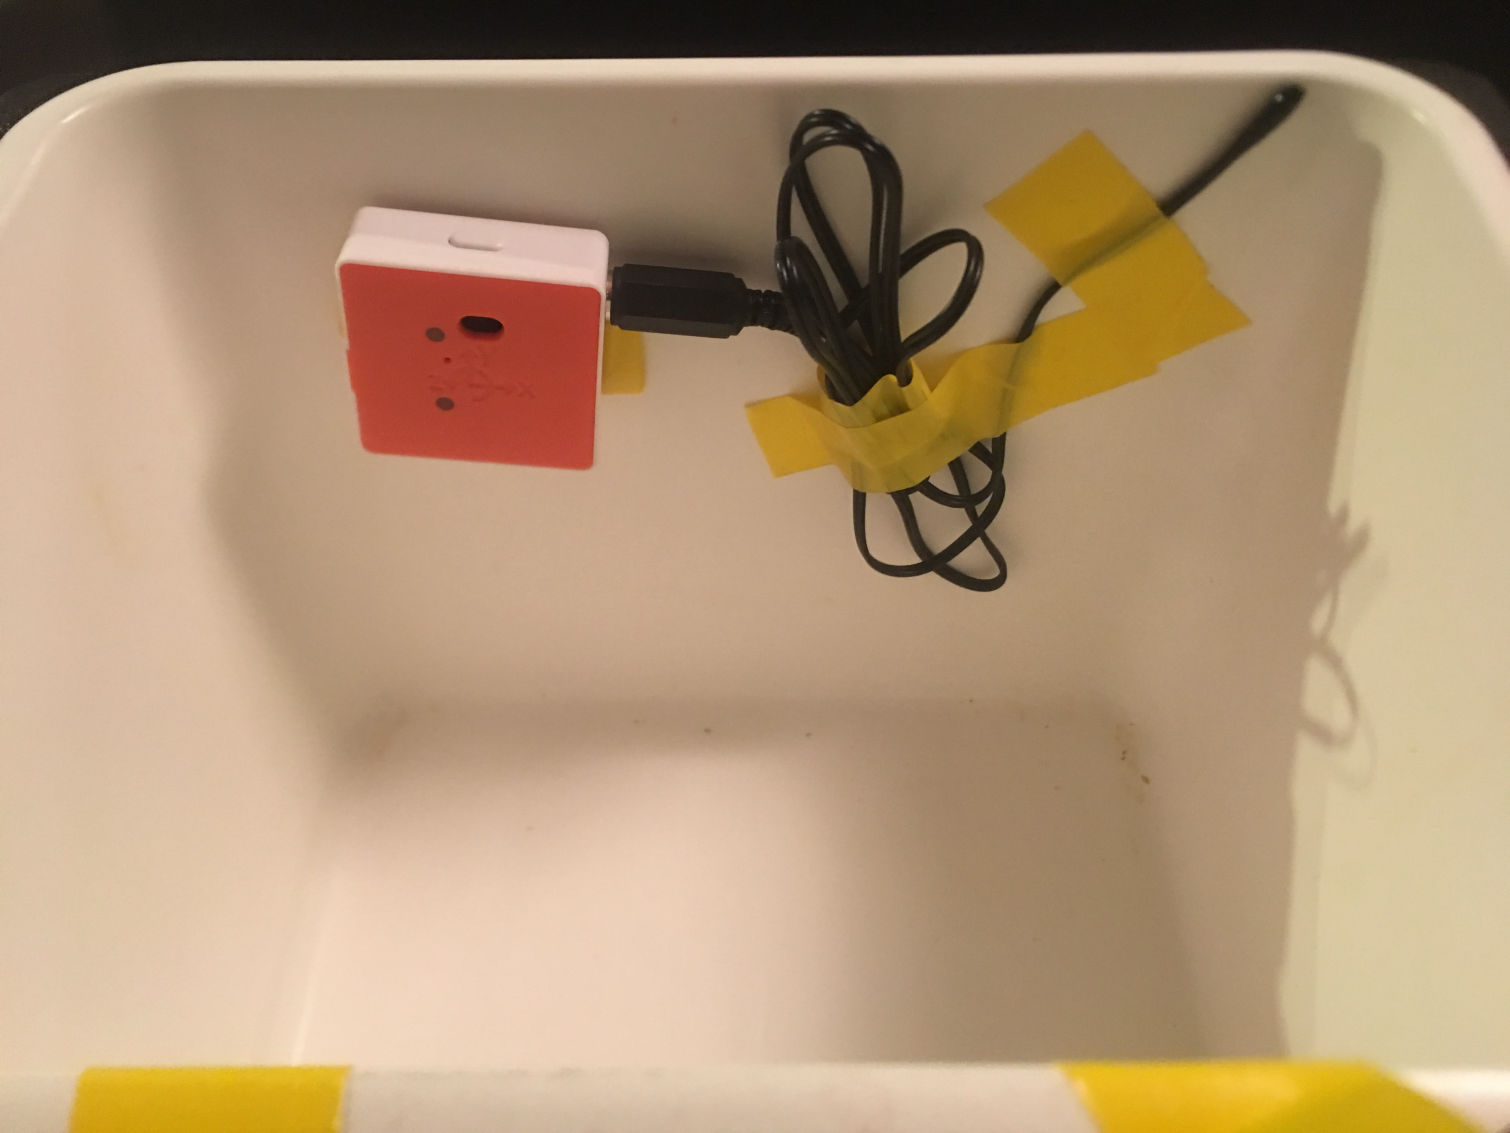
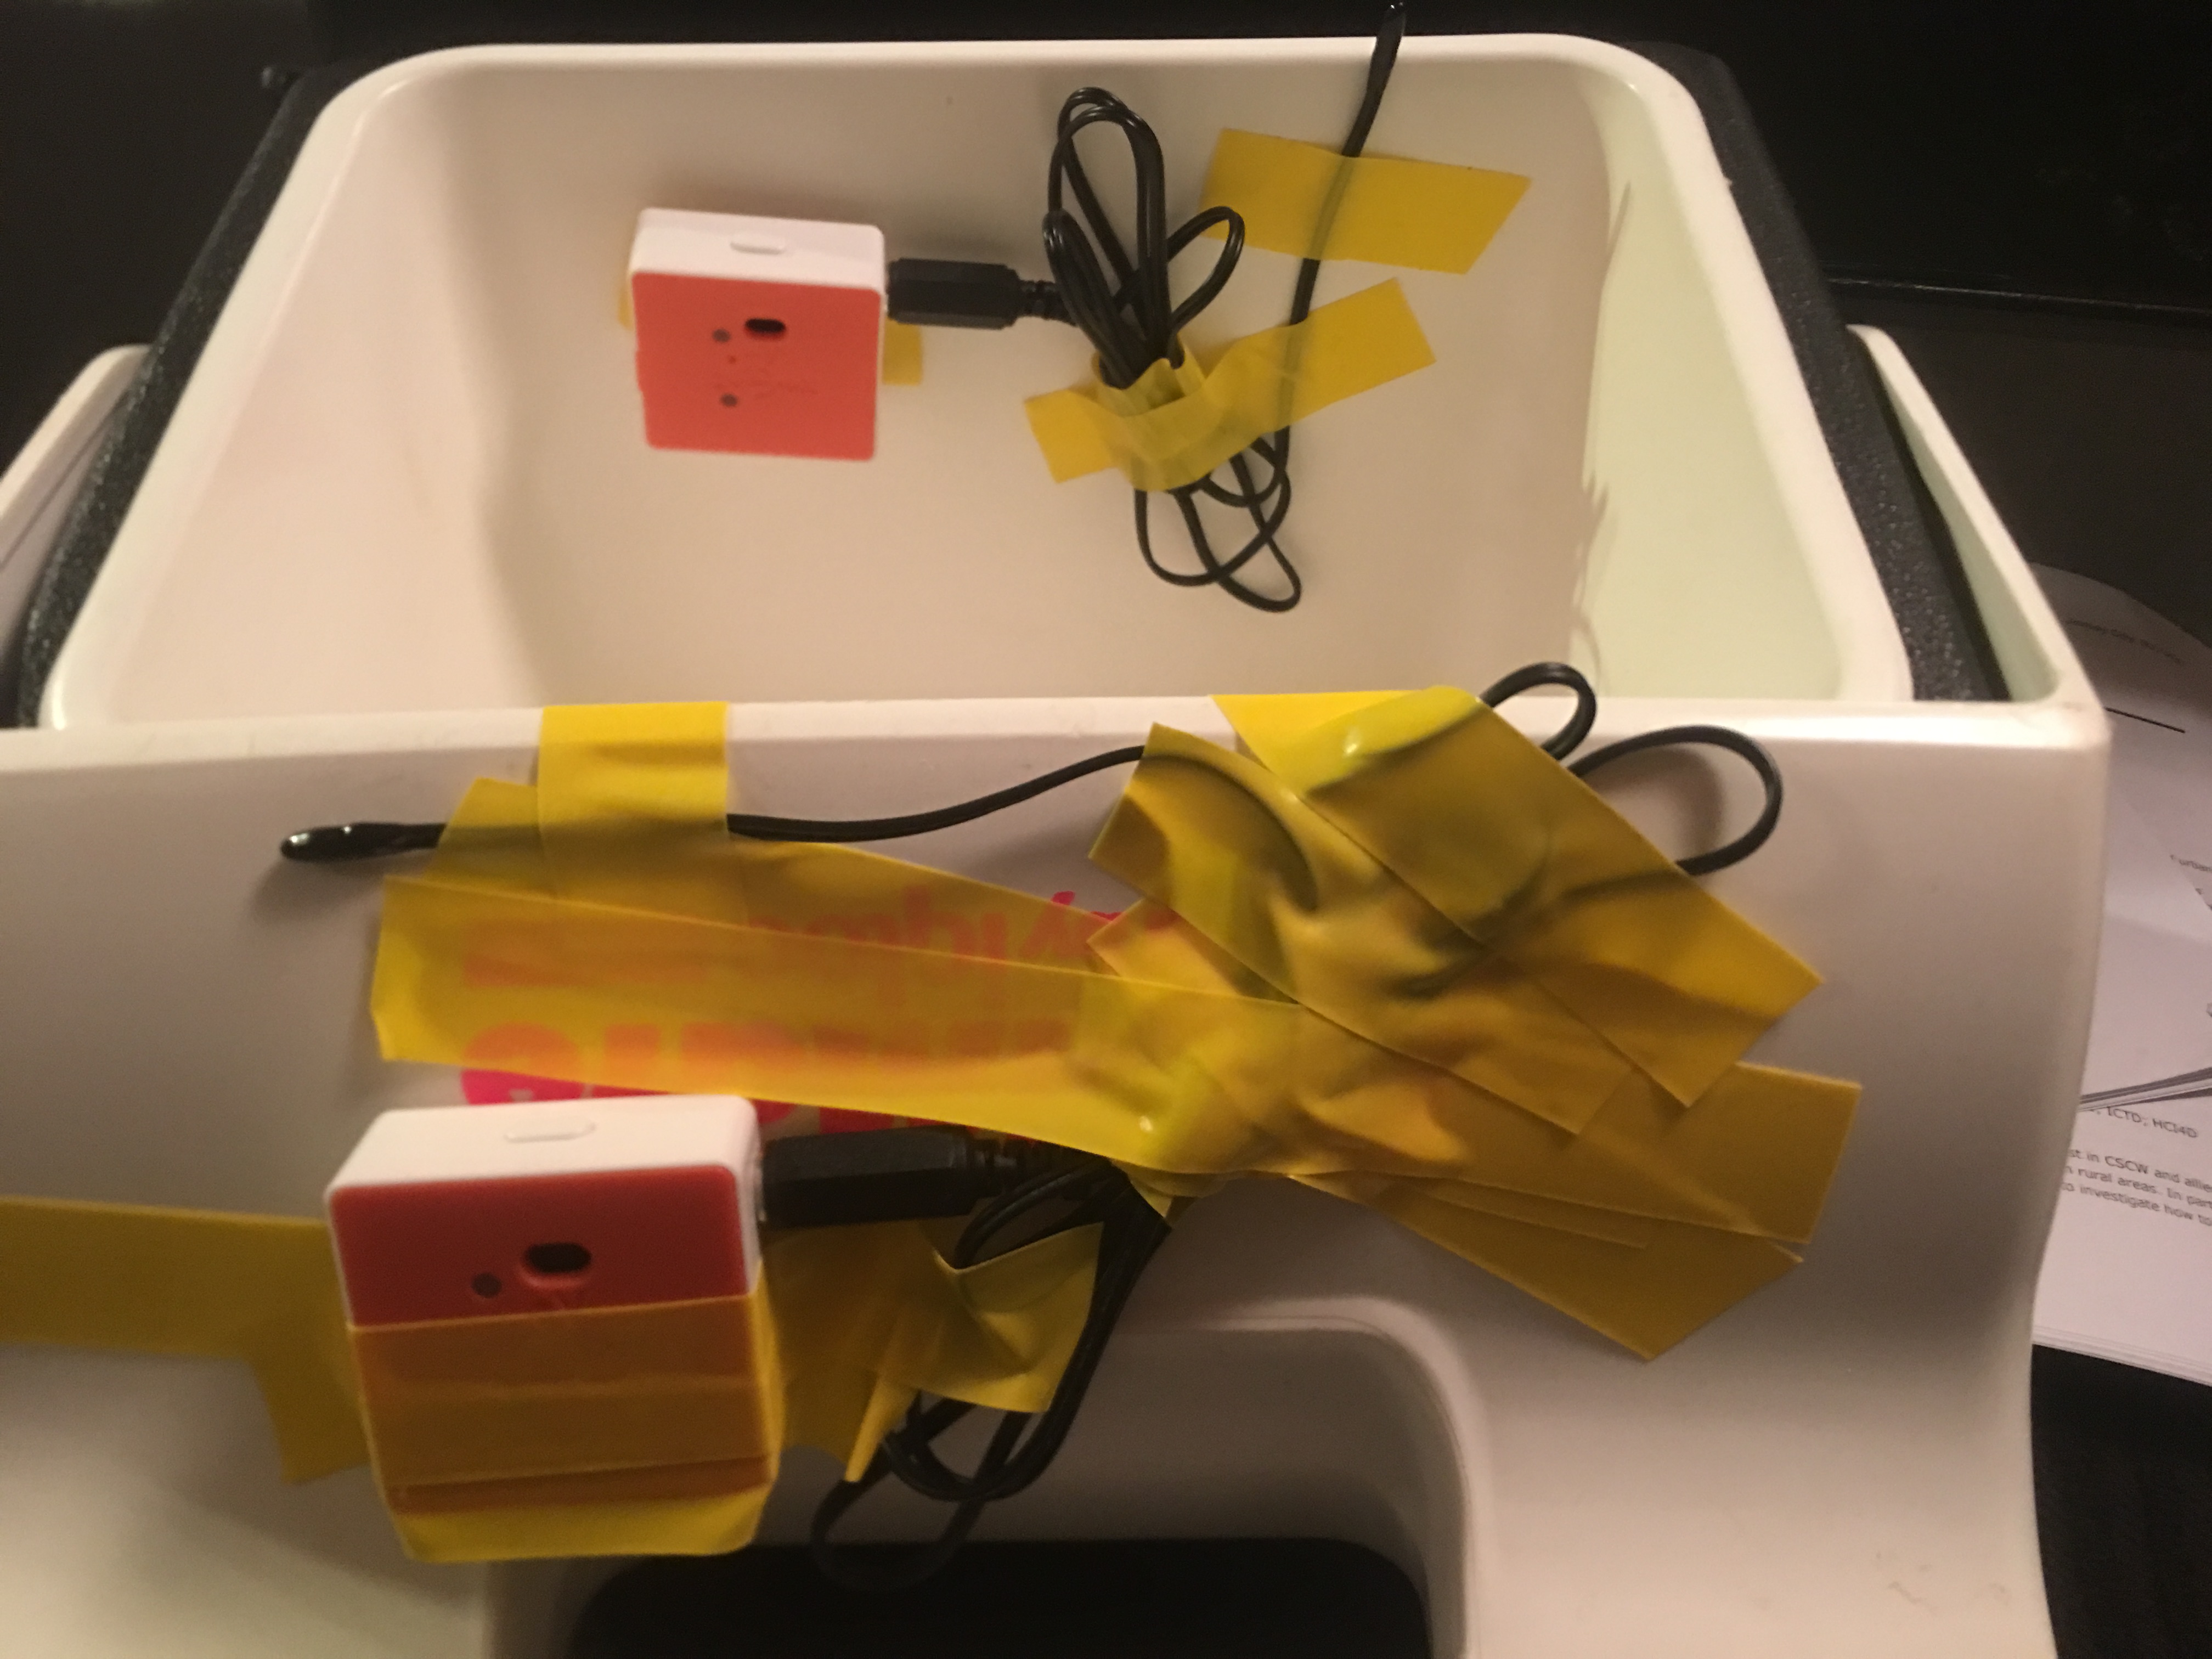
Project Materials
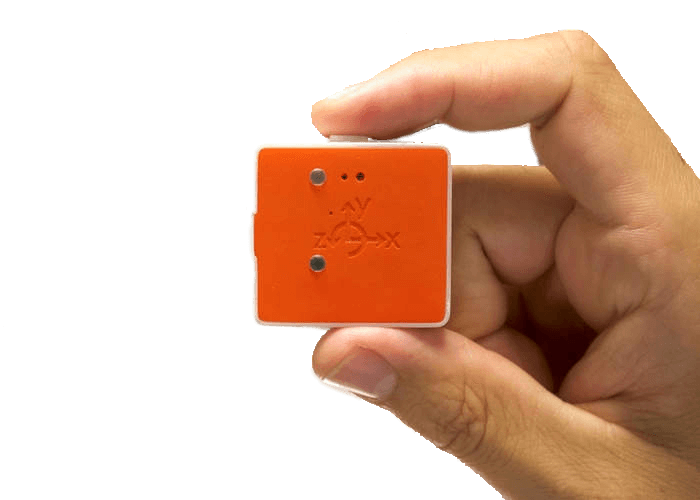
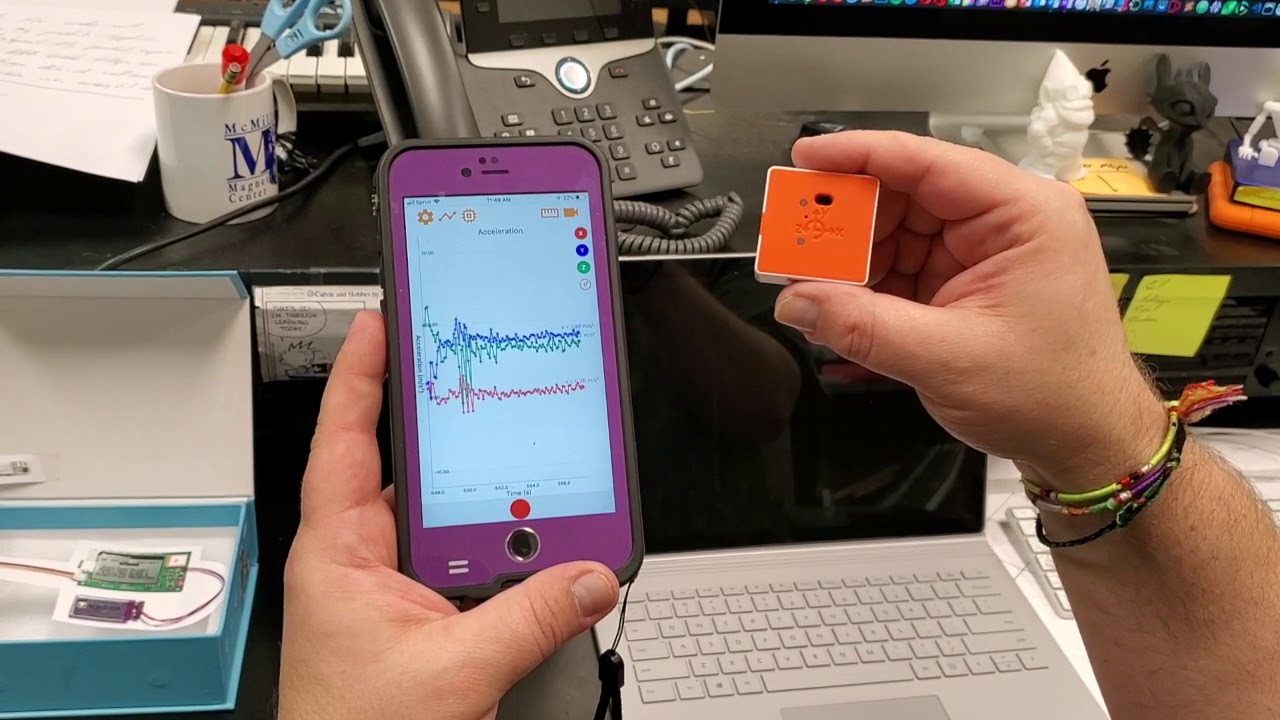
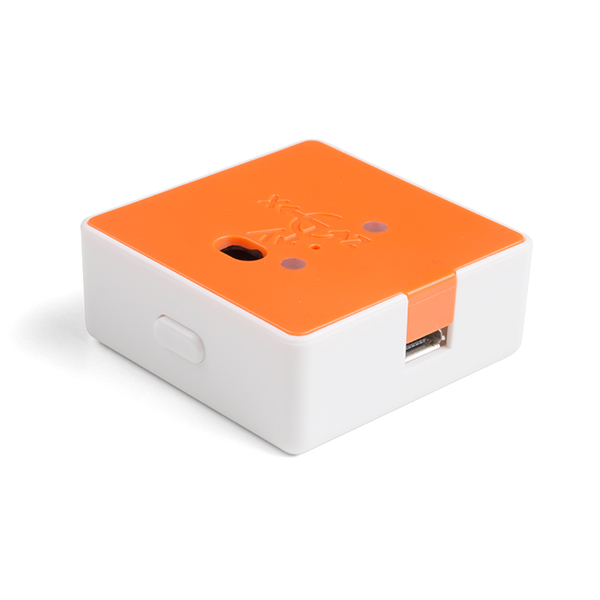
This product’s application is pretty straight forward. Once you have the PocketLab Voyager sensors you just need to "pair" them with a computer, iPad or Smartphone and choose what data you want recorded and then put the PocketLab Voyager into data collection mode. It will start collecting data automatically and will run until the memory is full or the battery fails. According to the documentation the battery has a about an 8 hour life span on a full charge.
Administrative materials: Code.org student accounts, access to Office 365 and OneDrive and Outlook email.
Instructional materials: Student lesson directions, teacher access to Excel, Word and PowerPoint. PowerPoints - for the all lessons loaded into Canvas and set with appropriate permissions. Student access to the In-class Activities, Assignment folder and data-sets.
Student/Class Materials: Access to Code.org, iMac Computers, Internet Access, Access to OPS Canvas LMS, access to Excel, Word and PowerPoint. Student access to all HAB datasets
Additional materials (might be used as part of the unit or lesson): Whiteboards with dry-erase Markers, paper to map out relationships and data prior to using software tools
Human Resources/aid: None.
| Item | Item Number | Vendor | Item Cost | Quantity | Cost |
|---|---|---|---|---|---|
| PocketLab Voyager | PL-Voyager | Myriad Sensors | $148.00 | 2 | $296.00 |
| VELCRO Strips | 90199 | Home Depot | $2.97 | 1 | $2.97 |
| Silicone Protective Case - Voyager | PLV-Case | Myriad Sensors | $10.00 | 2 | $20.00 |
| Total Cost | $318.97 |
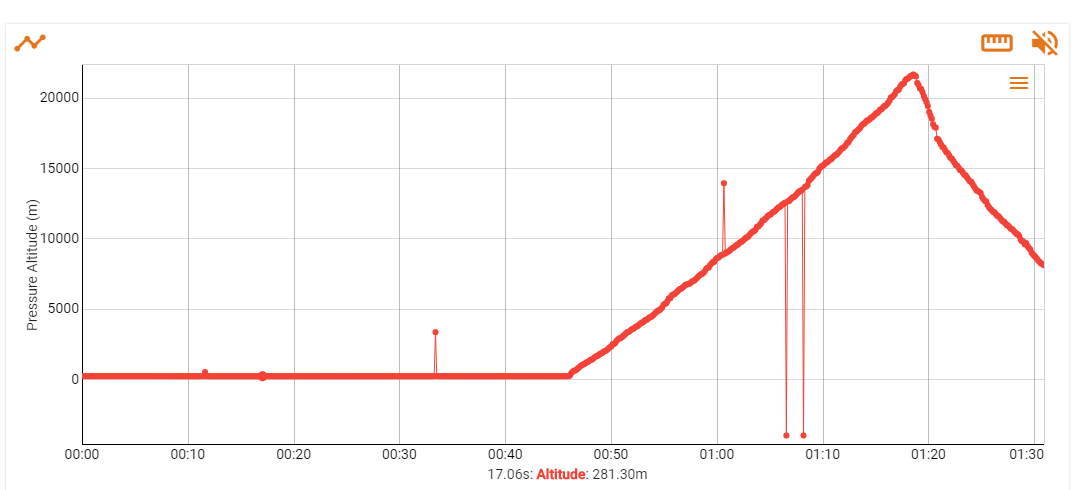
The first chart reflects the Altitude data during the flight.
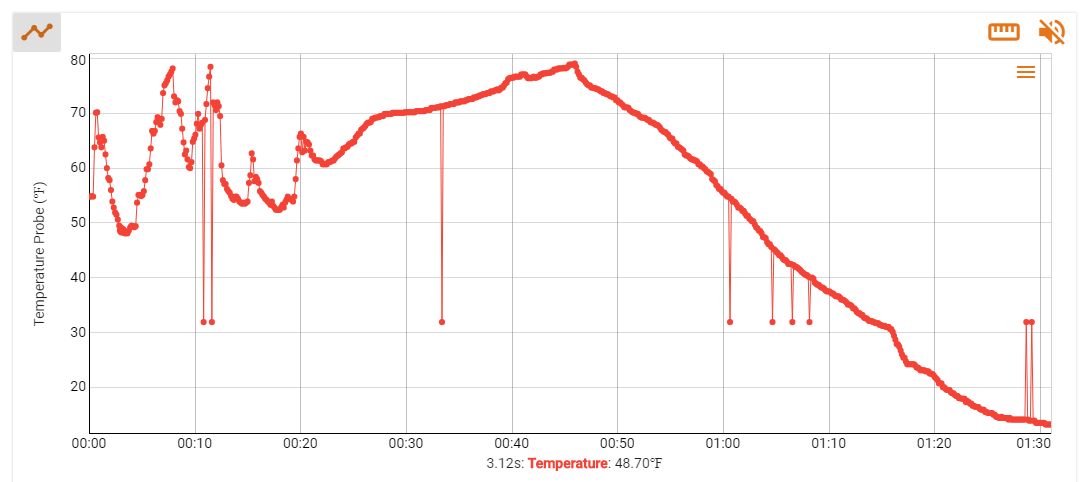
The second chart reflects the Temperature data recorded during the flight.
Video Demostrations


Product
Reflection & Evaluation
 The PocketLab Voyager sensor and datalogger pack combined with a battery pack will work well for the experiment and application that I have planned. The multiple datasets that will be generated and retrieved from the flight combined with the Microsoft’s Excel and possibly other web-based software provides a unique way to create data representation and visualizations in a lesson that meets my curricular standards and students’ needs. The biggest challenge for the students is to understand and work with the large amount of data, numbers and variables that will be generated and collected during the flight. Another challenge will be from the dataset itself. The dataset will have many lines of data that the students will have to sift through to decide what can be pulled out of the collected data and what that data says or represents. This might prove to be a very difficult task for those who have never worked with substantial amounts of data in this manner. Hopefully, Microsoft Excel can aid us in this endeavor. If successful this will be a very rewarding, unique and valuable learning experience for my students. One in which, to my knowledge the students have never been asked to do, attempt or complete before.
References
Computer Science Teachers Association (2017). CSTA K–12 Computer
Science Standards, Revised 2017. Retrieved January 14, 2019,
from http://www.csteachers.org/standards.
Myriad Sensors. (n.d.), PocketLab: Resources. N.p., n.d., Retrieved April 10, 2019 from https://www.thepocketlab.com/educators/resources
Nebraska Department of Education. (n.d.). 2018-2019 CTE course standards and 270411 [PDF file]. Retrieved January 22, 2019, from http://cestandards.education.ne.gov/Courses/270411_Middle%20School%20 Computer%20Science.pdf
NGSS Lead States. (2013). Next Generation Science Standards: Nebraska: MS.
Engineering Design. Retrieved March 10, 2019, from http://www.nextgenscience.org/
Address
3802 Reddick Ave
Omaha, NE
68112
Contacts
Email: Randall.Henderson@ops.org
Phone: 531-299-8922
School: 531-299-2440